As one of the main drivers in forecasting models, the relationship between GDP growth and air passengers naturally attracts much attention.
It is generally accepted that air passenger traffic grows at approximately twice the rate of national GDP, but how valid is this assumption? We analysed some publicly available datasets to investigate further.
Data for the UK provided by the Civil Aviation Authority (CAA) and Office for National Statistics (ONS) reveal 1990 – 2012 compound average growth rates of 1.6 per cent for GDP and 3.6 per cent for air passenger traffic. Although in this case traffic does indeed seem to grow at a rate twice that of national GDP, the same may not be true of all years or all locations.
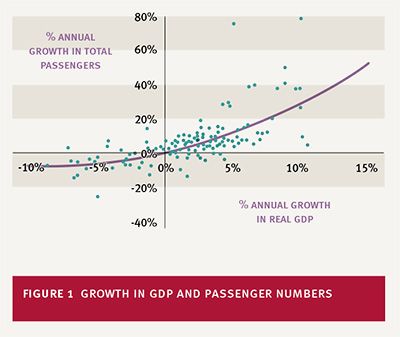
Eurostat data for a sample of 24 countries over the period 2004-2012, shows that the relationship between GDP and passenger growth rates might be described more accurately using a non-linear function. This indicates that, at high levels of GDP growth, the ratio of passenger growth to GDP growth exceeds 2:1, while at low levels of GDP growth the ratio is much lower.
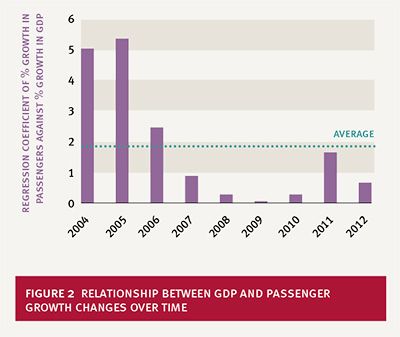
Since the dataset covers a period of economic recession, analysing the Eurostat data by year can tell us about the relationship at different points along the curve shown in Figure 1. Figure 2 presents the coefficient obtained by regressing the growth rate in passengers against the growth rate in GDP for the same sample of countries. Before the recession, passenger growth rates were around five times greater than GDP growth rates. However, between 2008 and 2010 passenger growth rates were less than one-third of the GDP growth rates. Although the average ratio for the period is indeed close to 2:1, this masks considerable variations. If the relationship can be this variable over a nine-year period, the consequences of using an average relationship for a 30 year forecast could be significant.
The analysis below aggregates data from 24 European countries, masking national variations. Over the period 2003-2012, passenger traffic in the UK grew at an average annual rate 1.4 times faster than GDP, while the corresponding ratio for Finland was 3.6. This could reflect the state of the aviation market in each country: while capacity and taxation policy restrict the UK’s passenger growth (particularly the domestic market), Finland has been developing an international hub at Helsinki and growth might be driven more by rapid GDP growth in Asia than national economic conditions. Subdividing the total passenger growth into different markets we can see that, in most of the sample countries, domestic passenger growth is much more closely aligned to GDP growth than international passenger growth. Therefore, the segmentation of the market being considered will affect its relationship with GDP growth. Furthermore, it is important to note that GDP is only one of a number of factors influencing traffic growth; full analysis would also include factors such as fares and competition from other modes.
It is clear from this that there is no one-size-fits-all multiplier to explain the relationship between GDP and air passengers. Rather than relying on generalisations, old research or accepted wisdom, it is necessary to analyse historical data to understand the specific relationship for the local market being forecast. As such an important driver of forecasting models, skipping this vital step in the process could prove to be a false economy.