The COVID-19 induced lockdown has halted movement economy-wide and resulted in a material impact on toll road traffic in India.
Looking back at the recorded traffic data from the onset of the nationwide lockdown in late March to May, publicly available information such as news articles, National Highways Authority of India (NHAI), industry research notes and our combined analysis, it is evident that there are a few overarching similarities in the traffic profile and volumes across the toll roads in India. Below we highlight the key five trends shaping the country’s toll road traffic:
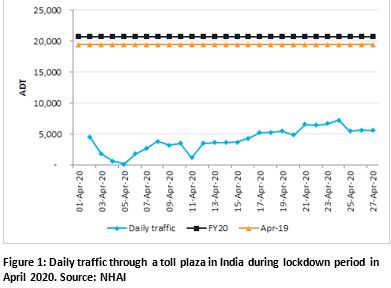
- Overall traffic volumes dropped by 20-30% in March as opposed to February, which translates to circa 2-3% drop in the FY20 annual average daily traffic (AADT*). This drastic drop in traffic volumes continued into April, where a further 50-60% drop was observed in daily traffic volumes. However, the gradual easing of lockdowns has seen an increase in traffic levels, recovering to around 40-60%.
- The drop in traffic levels was more apparent in cars, buses and light commercial vehicles (LCV), due to the suspension of all forms of non-essential movement during the lockdown. The traffic volumes within these vehicle categories were observed to be at about 10-20% of their pre-COVID levels. Alternatively, goods movement on heavy trucks has shown resilience, resulting in further relaxations and easing of movement restrictions over the course of the lockdown phases. Volumes of multi-axle vehicles (MAV) in May has reached 50-70% of pre-COVID levels at various toll roads.
- Various toll roads have responded differently to the restrictions during lockdown. Roads serving key areas like agriculture industry are still witnessing higher share of MAV traffic (~60-70% of FY20 traffic), while roads serving the industrial sector are more severely hit (30-40% of FY20 traffic).
- The level of economic activity in different parts of the country is being impacted by the red, amber, and green zoning system in place linked to the level of COVID-19 spread in each area, which in turn is impacting the movement of traffic to and from these areas.
- As of May 2020, the lockdown is gradually being lifted in a phased manner and there have been several relaxations in rules regarding movement of goods and people. The traffic levels on toll roads are seen to be steadily recovering and it is evident that the MAV traffic has recovered significantly over the past few weeks in May. However, it’s important to note that the traffic trends observed in April and May are likely to not be typical as several unusual factors, such as the movement of migrant labour in trucks and constrained demand for certain goods could be impacting traffic levels.
Despite our analysis, it is yet to be decided whether the traffic level recovery will balance to align with the post-COVID-19 economy. The situation remains dynamic, rapidly evolving and is subject to significant changes as the lockdown gradually lifts, however, the resuming of cross-border movements continues to stay limited and incoherent as state-wide restrictions remain intact.
*AADT is calculated as total number of vehicles passing a certain toll road divided by 365 days.