Electric vehicle chargepoint operators (CPO) are in a race to anticipate where, when, how and at what price drivers will ultimately choose to recharge their EVs. Unfortunately, with only 3% of the nation's cars and vans electrified, there isn't yet solid evidence as to whether drivers prefer slower “standard/fast” charging or much faster “rapid/ultra” charging. In the mean time, Zap Map's numbers themselves provide at least some insight to preferences in the current environment.
E-car and e-van drivers with access to private off-street parking or commercial depots will take most of their power from these cheap and convenient resources. Thereafter, a substantial portion of total charging demand will be supplied from public chargepoints.
Zap Map indicates that investors have installed 52,000 devices across 33,000 UK locations. These investments reflect the conviction of their ‘investor committees’ as to how drivers will “vote” with their fueling budgets across the two broad categories:
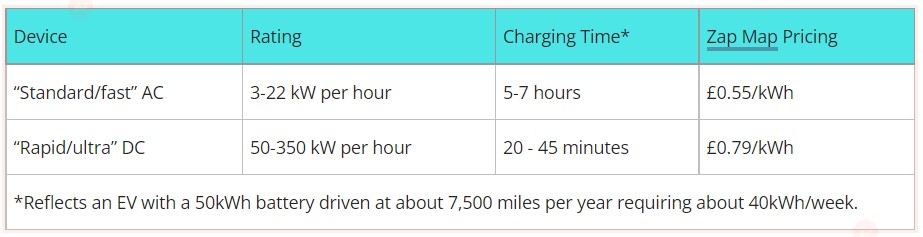
As shown in the left-hand column below, the overwhelming majority of installed chargers (roughly 80%) are of the standard/fast AC variety. These will largely be on curbsides or in parking lots where drivers can accommodate relatively long charging sessions (say, overnight or during the working day). The remaining 20% comprise rapid/ultra DC chargers, typically located at destinations (i.e., shopping, etc.) or designated charging forecourts. While charging via the slower and cheaper standard/fast device requires the driver to more deliberately plan their weekly power uptake, the more expensive rapid/ultra option allows fueling “as and when” needed.
At first blush, that 80% figure might seem to indicate a preference for the slower AC option, but multiplication of the sheer number of chargers by their respective power ratings (as shown in the right-hand column) indicates a very different picture:
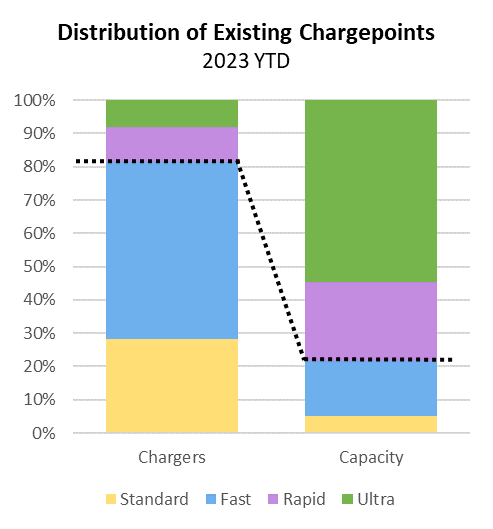
When reflected in terms of power-delivery capacity (i.e., the number of chargers multiplied by their respective rating), those rapid/ultra DC chargers, which comprise only 20% of the total number of chargers, deliver a whopping 80% of the power capacity supplied! If we assume that investors are developing charging infrastructure to satisfy demand (a dubious assumption at this point), the Zap Map numbers indicate that drivers prefer rapid/ultra charging.
I know, I know, this is a very tenuous observation based on a fairly low sample size at an early place in our EV adoption curve, but evidence is evidence. Furthermore, as more and various customer segments turn to EV, their demand may be for a very different type of charging infrastructure.
Conclusion
Because investment chases return, CPOs must identify not just the volume of anticipated demand, but also its how, when, where and price. Ultimately, EV charging is a game of attracting more than a pro rata share of demand in order to boost value and return.