With movement paralyzed overnight due to lockdown in March 2020, much of the transportation sector came to a halt. Initially, services were suspended, and people were not allowed to leave home, drive or board a train or flight home. A few weeks into the lockdown, certain exceptions were made, such as repatriation from international geographies and provision for labor movement from cities to their hometowns. Throughout all this, however, essential goods kept moving.
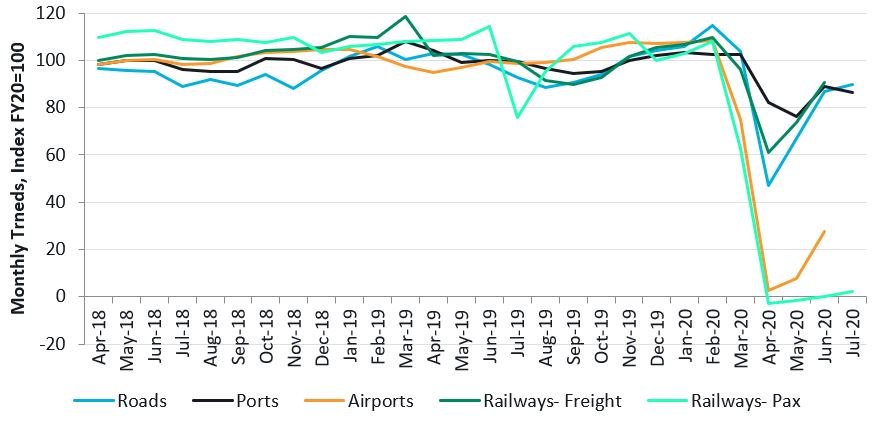
In this article, we have studied how roads, railways, airports and ports have fared since March 2020. We have compared annual average daily volumes – PCUs for roads, tonnes for ports, tonne kilometres and rail freight, ATMs for airports and passenger numbers for railways-pax – of April 2019 to March 2020 (FY20) as a benchmark. In the graph below, it looks like U, L, W to V-shaped recoveries are being witnessed across the transportation sector, and roads and ports are performing much better than airports and railways. In the following section, we have investigated the performance of each of the four modes.

Figure 1: Steer analysis of month on month traffic across different transport modes indexed to annual average daily volumes of FY20
Roads
To understand the impact of the lockdown on the roads sector, we look at historical traffic for a typical interurban toll road in India serving a mainly industrial corridor market and with a high proportion (>60% of total PCU’s) of trucks.
- Road to recovery: We presented an initial recovery analysis of road traffic in June which showed overall traffic volumes dropped by 50-60% in April as opposed to FY20 AADT. However, the gradual easing of lockdowns has seen an increase in traffic levels, recovering to around 70% in May and 85% in June. The recovery appears to be continuing in July with the catch up now at 90% of the traffic compared to FY20 AADT.
- Commercial vehicles which make up 30-40% of traffic volumes contribute over 70% of revenues. The national lockdown initially impacted the movement of goods, but the easing of restrictions has led to a quick recovery. By July 2020, heavy commercial vehicles, such as 3-Axle and multi-axle vehicle (MAV), have recovered to 85-90% of pre-lockdown levels across major national highways. Further growth in commercial traffic will depend upon an increase in manufacturing activity, which appears to be lagging as indicated in the latest industrial production statistics.
- Lagging passenger travels: The drop in traffic levels were more apparent in passenger vehicles, due to the suspension of all forms of non-essential movement. Traffic volumes for buses were about 30-40% of their pre-COVID levels. Car traffic has seen a relatively quick recovery; however, bus traffic remains 40-50% below the FY20 levels due to the public avoiding the use of public transport. Several local lockdowns at a state, city or district level and their corresponding impacts vary asset by asset depending on state rules, and passenger traffic levels remain volatile.
- Given the strong recovery trends seen in commercial vehicles, traffic volumes on major national highways are expected to recover within 90-95% of FY20 PCU levels. The assets carrying a higher share of agricultural produce are expected to recover faster compared to assets carrying industrial produce and automobiles.
Railways
Indian Railways witnessed the suspension of a majority of its passenger trains while it continued to support through reduced freight movement across the nation. Currently, only 230 special passenger trains are operating out of 7,000 run on a typical day.1
- Negative number of passengers? Passenger traffic is measured by the number of passengers booked on an originating basis, as published by Indian Railways. Since the first lockdown in India was implemented in the last ten days of March, it saw a sharp decline in passenger traffic, having booked passengers at 63% of FY20 average level.
Interestingly, since the number of passengers booked is taken as an approximate of passengers originating2, April and May reported a negative number of Indian Railways passengers, inferring that these were due to mass level ticket cancellations and a negligible amount of bookings. You can, therefore, notice a negative index value in the figure above.
- Freight cushioned the blow: As measured in Net Tonnes Kilometers (NTKM), April 2020 witnessed NTKM at 61% of FY20 levels, which have increased to 91% of FY20 levels in June 2020. To an extent, the losses to Indian Railways have been cushioned by freight movement, as cargo and parcel trains continued to operate through and after the lockdown.
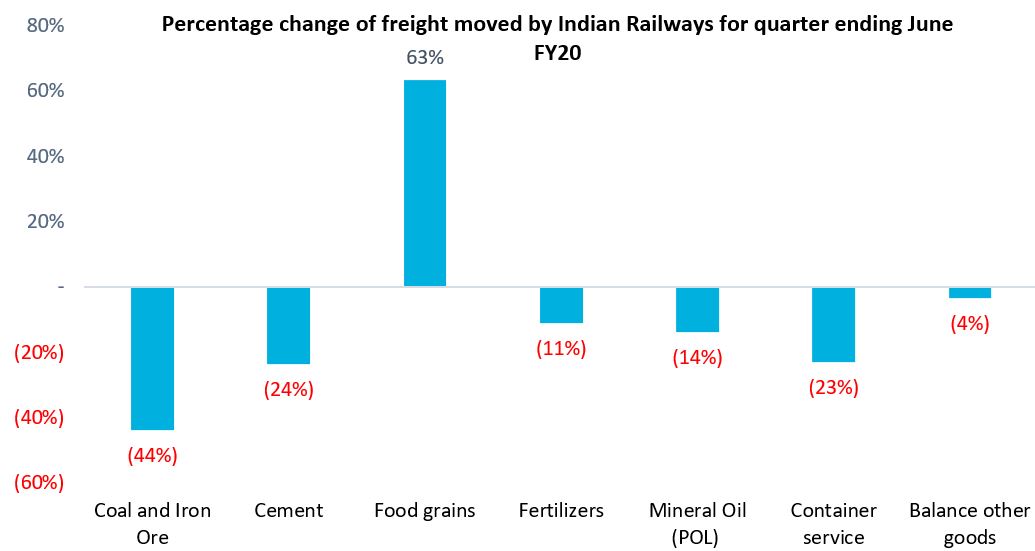
A comparison of commodity-wise NTKMs for Q1 in both FY20 and FY21 is presented in the graph below. While all the commodities except food grains witnessed a slight decrease in FY21 compared to FY20, NTKMs of food grains increased by 63% during the said period, becoming one of the major recovery factors for Indian railways, owing to the public food distribution programme run by the government.

Steer analysis, data sourced from Indian Railways
- What next for Indian Railways? For passenger demand to reach a full-fledged revival, Indian Railways would have to redefine its passenger on-boarding and journey experience in the wake of COVID-19 mitigation, which remains uncertain at this point in time.
Indian Railways is expecting an increase in losses from its passenger services, so it is strategizing ways to promote freight movement and increase its revenue share. With a focus on completing upcoming dedicated freight corridors and increasing freight train speeds, owing to decongestion from passenger trains, as well as various state-level restrictions on road freight, rail could see some increase in its modal share., However, we expect this to be limited to non-perishable food and bulk commodities. Furthermore, Indian Railways is also tending towards increased private participation in both passenger and freight operations that would improve its efficiency and services. Steer recently analyzed the implications of Request for Qualification by Indian Railways for private participation in passenger train operations.
Airports
For this analysis, we have indexed the annual average daily traffic of FY20 (sourced from Airports Authority of India (AAI)) based on air traffic movement (ATMs) encompassing freight and passenger movement, both domestic and international.
Given the complete shutdown of passenger movement, ATMs immediately declined to 3% and 8% of FY20 average level in April and May 2020 respectively. By June 2020, the ATMs had up ticked to 28% of FY20 levels, indicating a slight recovery.
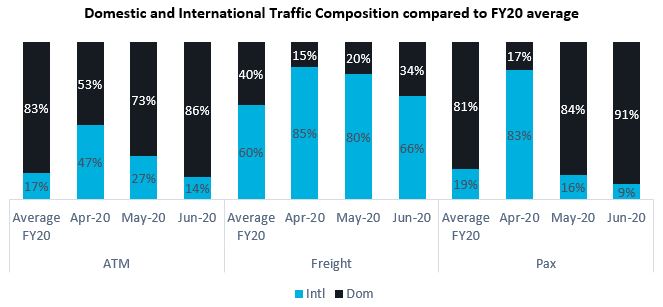
- International and domestic composition: Prior to March 2020, international ATMs averaged at about 17% of the total ATMs. However, during and after the lockdown, limited air traffic has been allowed to operate owing to a push from both the airlines and the government to increase air cargo movement and operate repatriation flights from the rest of the world. This resulted in international ATMs comprising of 47% of total ATMs in April 2020, servicing 83% of total passenger traffic and 85% of total freight movement for the same month, which would typically be 19% and 60% respectively (refer to the graph below). With airlines also resuming limited domestic passenger services post-lockdown, at 33% capacity in May onward and later increased to 45% in June, the proportion of domestic passenger traffic to total traffic seemed to have normalized by June 2020.

Steer analysis, data sourced from Airports Authority of India
- Regaining strength: While total ATMs in June 2020 were at 28% of FY20 levels, the traffic distribution of both passenger and freight across domestic and international routes is inching towards FY20 average levels. Going forward, India could expect to see its air passenger traffic recover at a faster pace compared to its international counterparts, since, on average, over 80% of total passenger traffic is domestic emerging from metropolitan cities. With Delhi and Mumbai airports accounting for nearly 30% of total domestic demand and 40% of international demand, and both cities currently witnessing a declining trend in the number of active Covid-19 cases, further opening of services will boost demand for air travel. Thus, as it becomes safer to travel, and with increased flight frequency, domestic flights can potentially witness latent demand from its urban centers.
Furthermore, domestic operators in India have recently announced their expansion to international routes, such as Vistara buying slots at London Heathrow Airport starting in September 2020. Such expansions would receive a boost as India signs air bubble arrangements with selected countries, allowing for international flights for Overseas Citizenship of India (OCI) cardholders as well as foreigners to avail Indian visas for business, medical and employment purposes.
Ports
The import and export cargo volumes handled at ports are an important economic indicator. As a fallout of the lockdown, overall cargo volumes at major Indian ports contracted by over 18% during Q1 FY21 compared to the first quarter of FY20. Non-major ports also experienced a similar drop in volumes. The cargo volumes handled at Adani Ports (Mundra, Dhamra, Kattupalli, Hazira and Dahej) witnessed a drop of over 25% during Q1 FY21 versus Q1 FY20.
- Multi-factor impact: The fall in cargo handled at the ports could be attributed to multiple factors such as subdued global trade, contraction in domestic industrial activity and logistics bottlenecks impacting evacuation of cargo from the port warehouses, especially by roads.
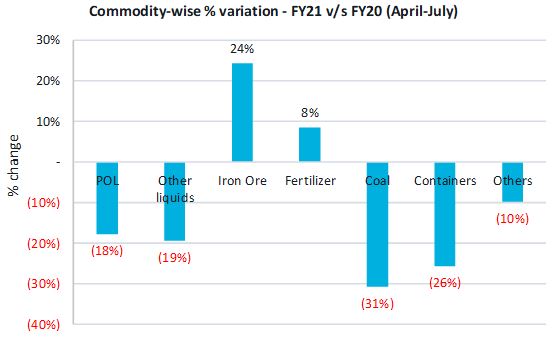
- Reduced power demand: In terms of commodity-wise fall in traffic, coal and container segments have been the most impacted. Given the drop in power demand due to lower industrial activity, the thermal coal imports of India have dropped drastically and ports handling coal and container, such as JNPT, Kamarajar, Chennai and Cochin, witnessed a maximum fall in cargo levels.
- Demand from China: Iron-ore and fertilisers are the two commodities which continued to perform positively during this period. The fall in traffic observed at ports handling these commodities, Paradip (iron-ore) and V.O Chidambaranar (fertilisers), has been less pronounced (-9%) compared to other major ports (-25%). Given strong demand from China, with its steel production now exceeding FY20 levels and constraints in other large mining countries like Brazil and Australia, iron ore exports from eastern states of India have resulted in Paradip port witnessing an increase of over 40% in iron-ore handled during April-July 2020 compared to the same period in 2019. As restrictions on the export from other iron ore producing states like Karnataka and Goa continues, this trend is expected to sustain the rest of this year.
- Goods moving forward: With the gradual opening of the economy in July, and faster evacuation at ports and warehouses, the cargo volumes at major ports have recovered to around 90% of the FY20 average. We expect this trend to continue going forward and believe that the recovery in the port sector will be directly linked to the revival of domestic industrial activity and global demand.

Steer analysis, data sourced from Indian Ports Association
